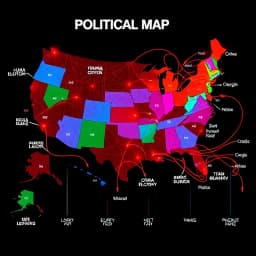
Political Map Illustration Generator
Find this useful? Bookmark ( CTRL/CMD + D ) for quick access!
Try an example:
Election Result Visualization
Political Party Distribution Map
Voter Demographics Illustration
Historical Political Changes Map
Policy Impact Assessment Map
Geopolitical Tension Visualization
Explore Similar Tools
Recent Generations
Taco Bar Party Ideas
the amount paid directly to you. Yes it is possible in future cases to request direct payment to the provider, Rephrase and give me polished email.
Claim Email Template
we have processed the claim as per the attachments in the claim submission we have processedthe invoice for Saul Holding. We dont have invoice for the Salofalk.
Claim Email Template
this additional information is very important. this adiitional information was requested by our clinical team. Without clinical review claim not be paid so please share the below additional information
Political Map Illustration Generator
The Political Map Illustration Generator is a cutting-edge AI-powered tool designed to create visually stunning and informative political maps effortlessly. This innovative solution combines advanced machine learning algorithms with user-friendly design features to deliver customized maps that cater to various political contexts and needs.
Key Capabilities
- Customizable Map Designs with various styles and color schemes, allowing users to create maps that align with their branding or presentation needs.
- Real-Time Data Integration enabling users to incorporate the latest political data, ensuring that maps reflect current events and trends accurately.
- User-Friendly Interface for easy navigation and map creation, making it accessible for both beginners and experienced designers.
- Export Options in multiple formats (PNG, PDF, SVG) to facilitate seamless sharing and integration into reports, presentations, or websites.
Who It's For
Designed for political analysts, educators, and content creators, the Political Map Illustration Generator excels in producing maps for presentations, educational materials, and research projects. Whether you're crafting a detailed electoral map or an engaging infographic, this tool streamlines your workflow and enhances visual communication.
Why Choose Political Map Illustration Generator
What sets the Political Map Illustration Generator apart is its ability to combine sophisticated data visualization with intuitive design features, making it the ideal solution for anyone looking to convey complex political information clearly and effectively.
Ready to transform your political presentations? Start using the Political Map Illustration Generator today and experience the difference in your visual storytelling!
Enhance Your Work with Political Map Illustration Generator
Leverage the power of AI to streamline your tasks with our Political Map Illustration Generator tool.
Customizable Political Boundaries
Easily adjust and define political boundaries to create maps that reflect specific regions or districts.
Multi-Layer Mapping
Overlay multiple data layers, such as demographics and election results, for a comprehensive political overview.
Interactive Visualization
Engage users with interactive maps that allow for zooming, panning, and detailed exploration of political data.
How Political Map Illustration Generator Works
Discover the simple process of using Political Map Illustration Generator to improve your workflow:
Upload Your Political Data
Begin by uploading your political data files, such as election results or demographic information, to our platform.
Select Map Type
Choose the type of political map you want to create, such as electoral districts, voting trends, or demographic distributions.
AI Map Generation
Our AI tool processes your data and generates a detailed political map based on your selections and preferences.
Review and Customize
Examine the generated map and make any necessary adjustments or customizations to suit your needs.
Use Cases of
Political Map Illustration Generator
Explore the various applications of Political Map Illustration Generator in different scenarios:
Election Campaign Planning
Visualize electoral districts and voter demographics to strategize campaign efforts and resource allocation.
Policy Impact Analysis
Illustrate the geographical impact of proposed policies or legislation to inform stakeholders and the public.
Voter Engagement Initiatives
Create engaging maps that highlight voter turnout and demographic trends to encourage civic participation.
Political Risk Assessment
Generate maps that assess political stability and risks in different regions to guide investment and business decisions.
Who Benefits from Political Map Illustration Generator?
AI-Powered Efficiency
From individuals to large organizations, see who can leverage Political Map Illustration Generator for improved productivity:
Political Campaign Teams
Visualize electoral districts and voter demographics to strategize campaign efforts.
Political Analysts
Analyze political trends and voter behavior through detailed geographical representations.
Civic Organizations
Engage communities by illustrating political boundaries and local issues effectively.
Educators and Students
Enhance learning about political geography and electoral processes with visual aids.
Frequently Asked Questions
What is the Political Map Illustration Generator?
The Political Map Illustration Generator is an AI tool designed to create detailed and visually appealing political maps based on user-defined parameters, such as geographical regions, political boundaries, and demographic data.
How do I use the Political Map Illustration Generator?
To use the generator, simply input your desired parameters, such as the region, political entities, and any specific data points you want to visualize. The AI will then create a customized political map for you.
Can I customize the appearance of the maps?
Yes, the tool allows for extensive customization options, including color schemes, labels, and styles, enabling you to create maps that fit your specific aesthetic and informational needs.
Is the generated map suitable for publication?
Absolutely! The Political Map Illustration Generator produces high-resolution maps that are suitable for both digital and print publication, ensuring clarity and professionalism in your presentations.
What types of data can I input into the generator?
You can input various types of data, including electoral results, population demographics, and historical political boundaries. The tool is designed to handle diverse datasets to create informative maps.


